Report highlights. According to the latest major data from 2023, approximately 32% of American adults have at least one tattoo—equating to roughly 82 million people. The landscape of body art has shifted dramatically, with Millennials leading the charge at 46%, and women now surpassing men in prevalence (38% vs 27%). Interestingly, income data reveals an inverse relationship: 43% of lower-income Americans have tattoos compared to just 21% of adults in upper-income brackets.
Key Findings at a Glance:
- Total Prevalence: 32% of U.S. adults have at least one tattoo (2023).
- “Addiction” Factor: Tattoos are rarely a one-time event; 22% of Americans have multiple tattoos, meaning 69% of tattooed people don’t stop at one.
- Frequency: The average tattooed person has approximately 4 tattoos.
- Generational Peak: 46% of Millennials (ages 30-49) are tattooed—the highest adoption rate of any generation.
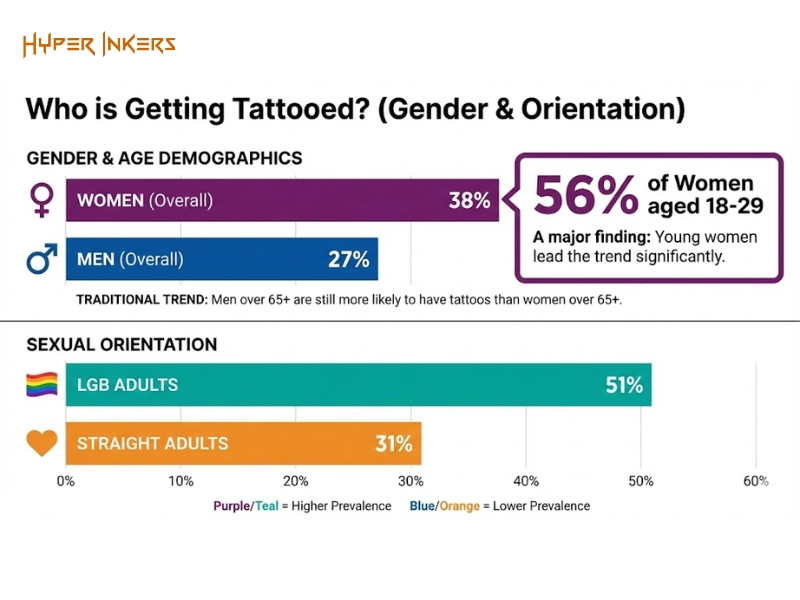
- Gender Shift: 38% of women have tattoos vs 27% of men—marking a historic gender reversal.
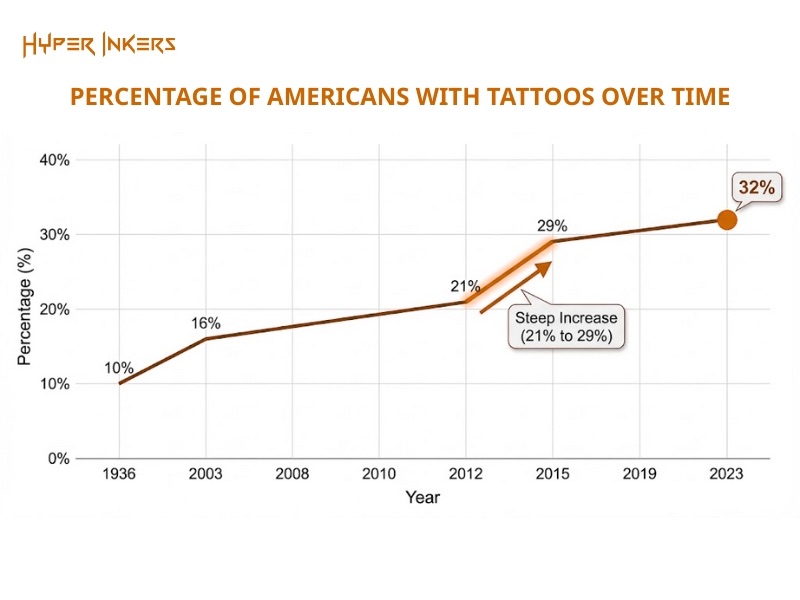
- Growth: Tattoo prevalence has tripled since the mid-20th century (rising from ~10% to 32%).
Tattoo prevalence by generation, 2023
Related reports include: Where tattoos are most popular | Tattoo regret statistics
1. How Has Tattoo Popularity Changed Over Time?
Tattoo acceptance has moved from the fringes of society to the mainstream. The data reveals a steady upward trajectory, with the most rapid period of normalization occurring between 2012 and 2015, where prevalence jumped from 21% to 29% in just three years.
| Year | Percentage with tattoos | Source |
| 1936 | ~10% | Life Magazine |
| 2003 | 16% | Harris Poll |
| 2008 | 14% | Harris Poll |
| 2010 | 23% | Pew Research |
| 2012 | 21% | Harris Poll/Ipsos |
| 2015 | 29% | Harris Poll |
| 2019 | 30% | Ipsos |
| 2023 | 32% | Pew Research |
| 2025 | 24%* | YouGov |
*Note: The variance seen in the 2025 YouGov data (24%) compared to Pew’s 2023 data (32%) likely highlights methodological differences rather than a genuine sharp decline in popularity.
2. Tattoo Statistics by Generation: Millennials vs. Boomers
Generational differences in body art are stark. Millennials currently hold the title for the most tattooed generation, with nearly half of the demographic sporting ink. Meanwhile, Gen Z is rapidly adopting the practice, though age restrictions currently limit their full statistical impact.
| Generation | Tattoo Prevalence | Age Range (2023) |
| Millennials (1981-1996) | 46-47% | 27-42 years |
| Gen Z (1997-2012) | 41% (under 30) | 11-26 years |
| Gen X (1965-1980) | 25-36% | 43-58 years |
| Baby Boomers (1946-1964) | 13-25% | 59-77 years |
| Silent Generation (pre-1946) | 10-13% | 78+ years |
Contextual Analysis:
- Collection Behavior: 37% of Millennials have multiple tattoos compared to only 6% of Baby Boomers, indicating tattoos are a lifestyle choice rather than an experiment for this group.
- Rising Trend: Among adults under 30, 41% now have at least one tattoo.
- Future Outlook: Gen Z’s full adoption rate remains to be determined as many are still below the legal tattooing age.

3. Gender and Identity: A Historic Reversal
One of the most significant findings in recent years is the shift in gender demographics. Women have definitively overtaken men in tattoo prevalence, challenging historical norms where tattoos were predominantly associated with male-dominated subcultures.
Women Lead in Tattoo Adoption
- The Gap: 38% of American women have at least one tattoo compared to 27% of American men—an 11-percentage-point gap.
- Young Women: Among women ages 18-29, the number rises to 56%.
- Peak Demographic: Women ages 25-29 show the highest prevalence of any demographic group at 45%.
Historical Gender Patterns
Data from older demographics reflects the cultural history of tattooing. Among adults 65+, men are 71% more likely to be tattooed than women. This disparity reflects traditional associations with military service and male-centric groups common in the mid-20th century. The current generational shift represents fundamental changes in gendered self-expression.
Impact of Sexual Orientation
Self-expression through body art is particularly high within the LGB community:
- 51% of LGB Americans have at least one tattoo.
- 68% of LGB women are tattooed—the highest rate of any single demographic group.
- In comparison, 31% of straight Americans have tattoos.
4. Demographics and Income: Who is Getting Inked?
Contrary to the perception that tattoos are a luxury expense, income statistics show a clear inverse relationship with tattoo prevalence across all major studies.
| Income Level | Tattoo Prevalence |
| Lower-income | 43% |
| Middle-income | 31% |
| Upper-income | 21% |
Education levels mirror this trend:
- 37% of those with some college or less are tattooed.
- 24% of bachelor’s degree holders have tattoos.
- 21% of postgraduate education holders are tattooed.
Other Demographic Factors:
- Religion: 41% of religiously unaffiliated Americans have tattoos vs 29% of religious Americans.
- Political Party: There is no significant difference, with both Democrats and Republicans showing a 32-33% adoption rate.
- Location: Geography is not a major factor; urban, suburban, and rural areas all hover around ~33%.
- Veteran Status: Surprisingly, there are no significant differences from the general population.
5. Multiple Tattoos and Placement Preferences
For the majority of enthusiasts, one tattoo is rarely enough. The data suggests that once the barrier of the first tattoo is broken, “collecting” becomes common.
- Multiple Inks: 69% of tattooed Americans have two or more tattoos.
- Heavy Collectors: 20% have more than five tattoos.
- Average: The average tattooed person has approximately 4 tattoos.
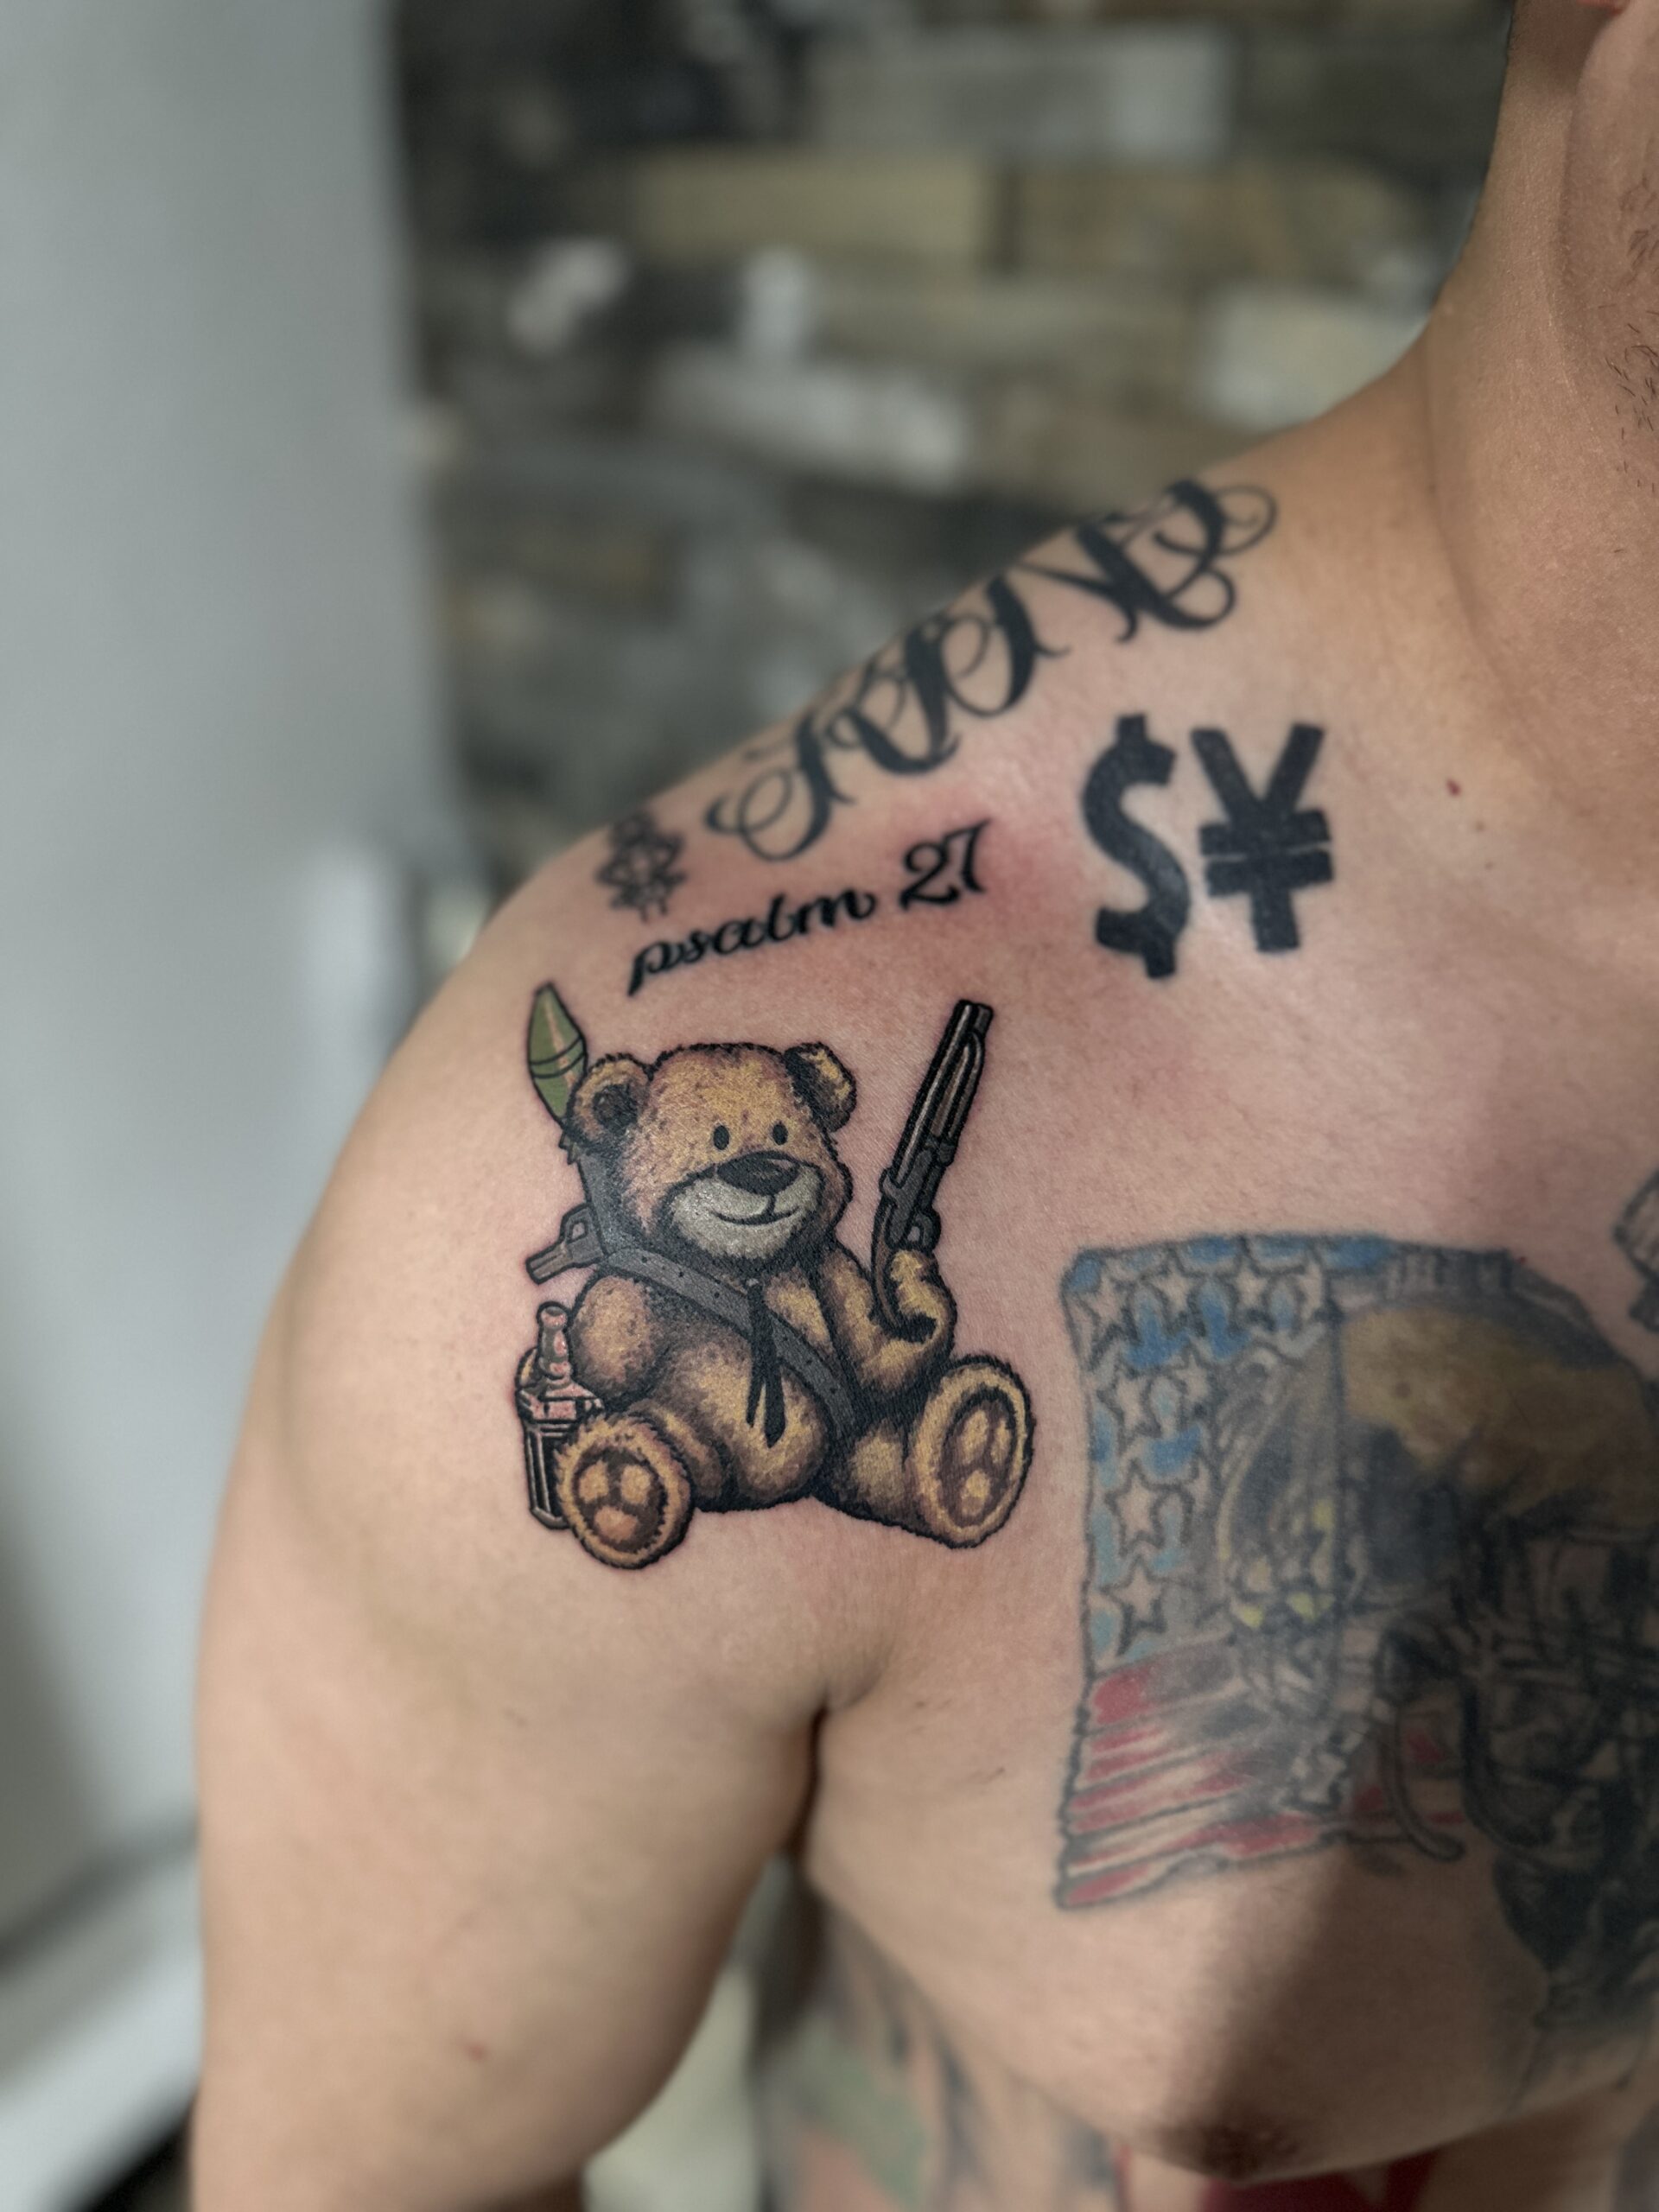
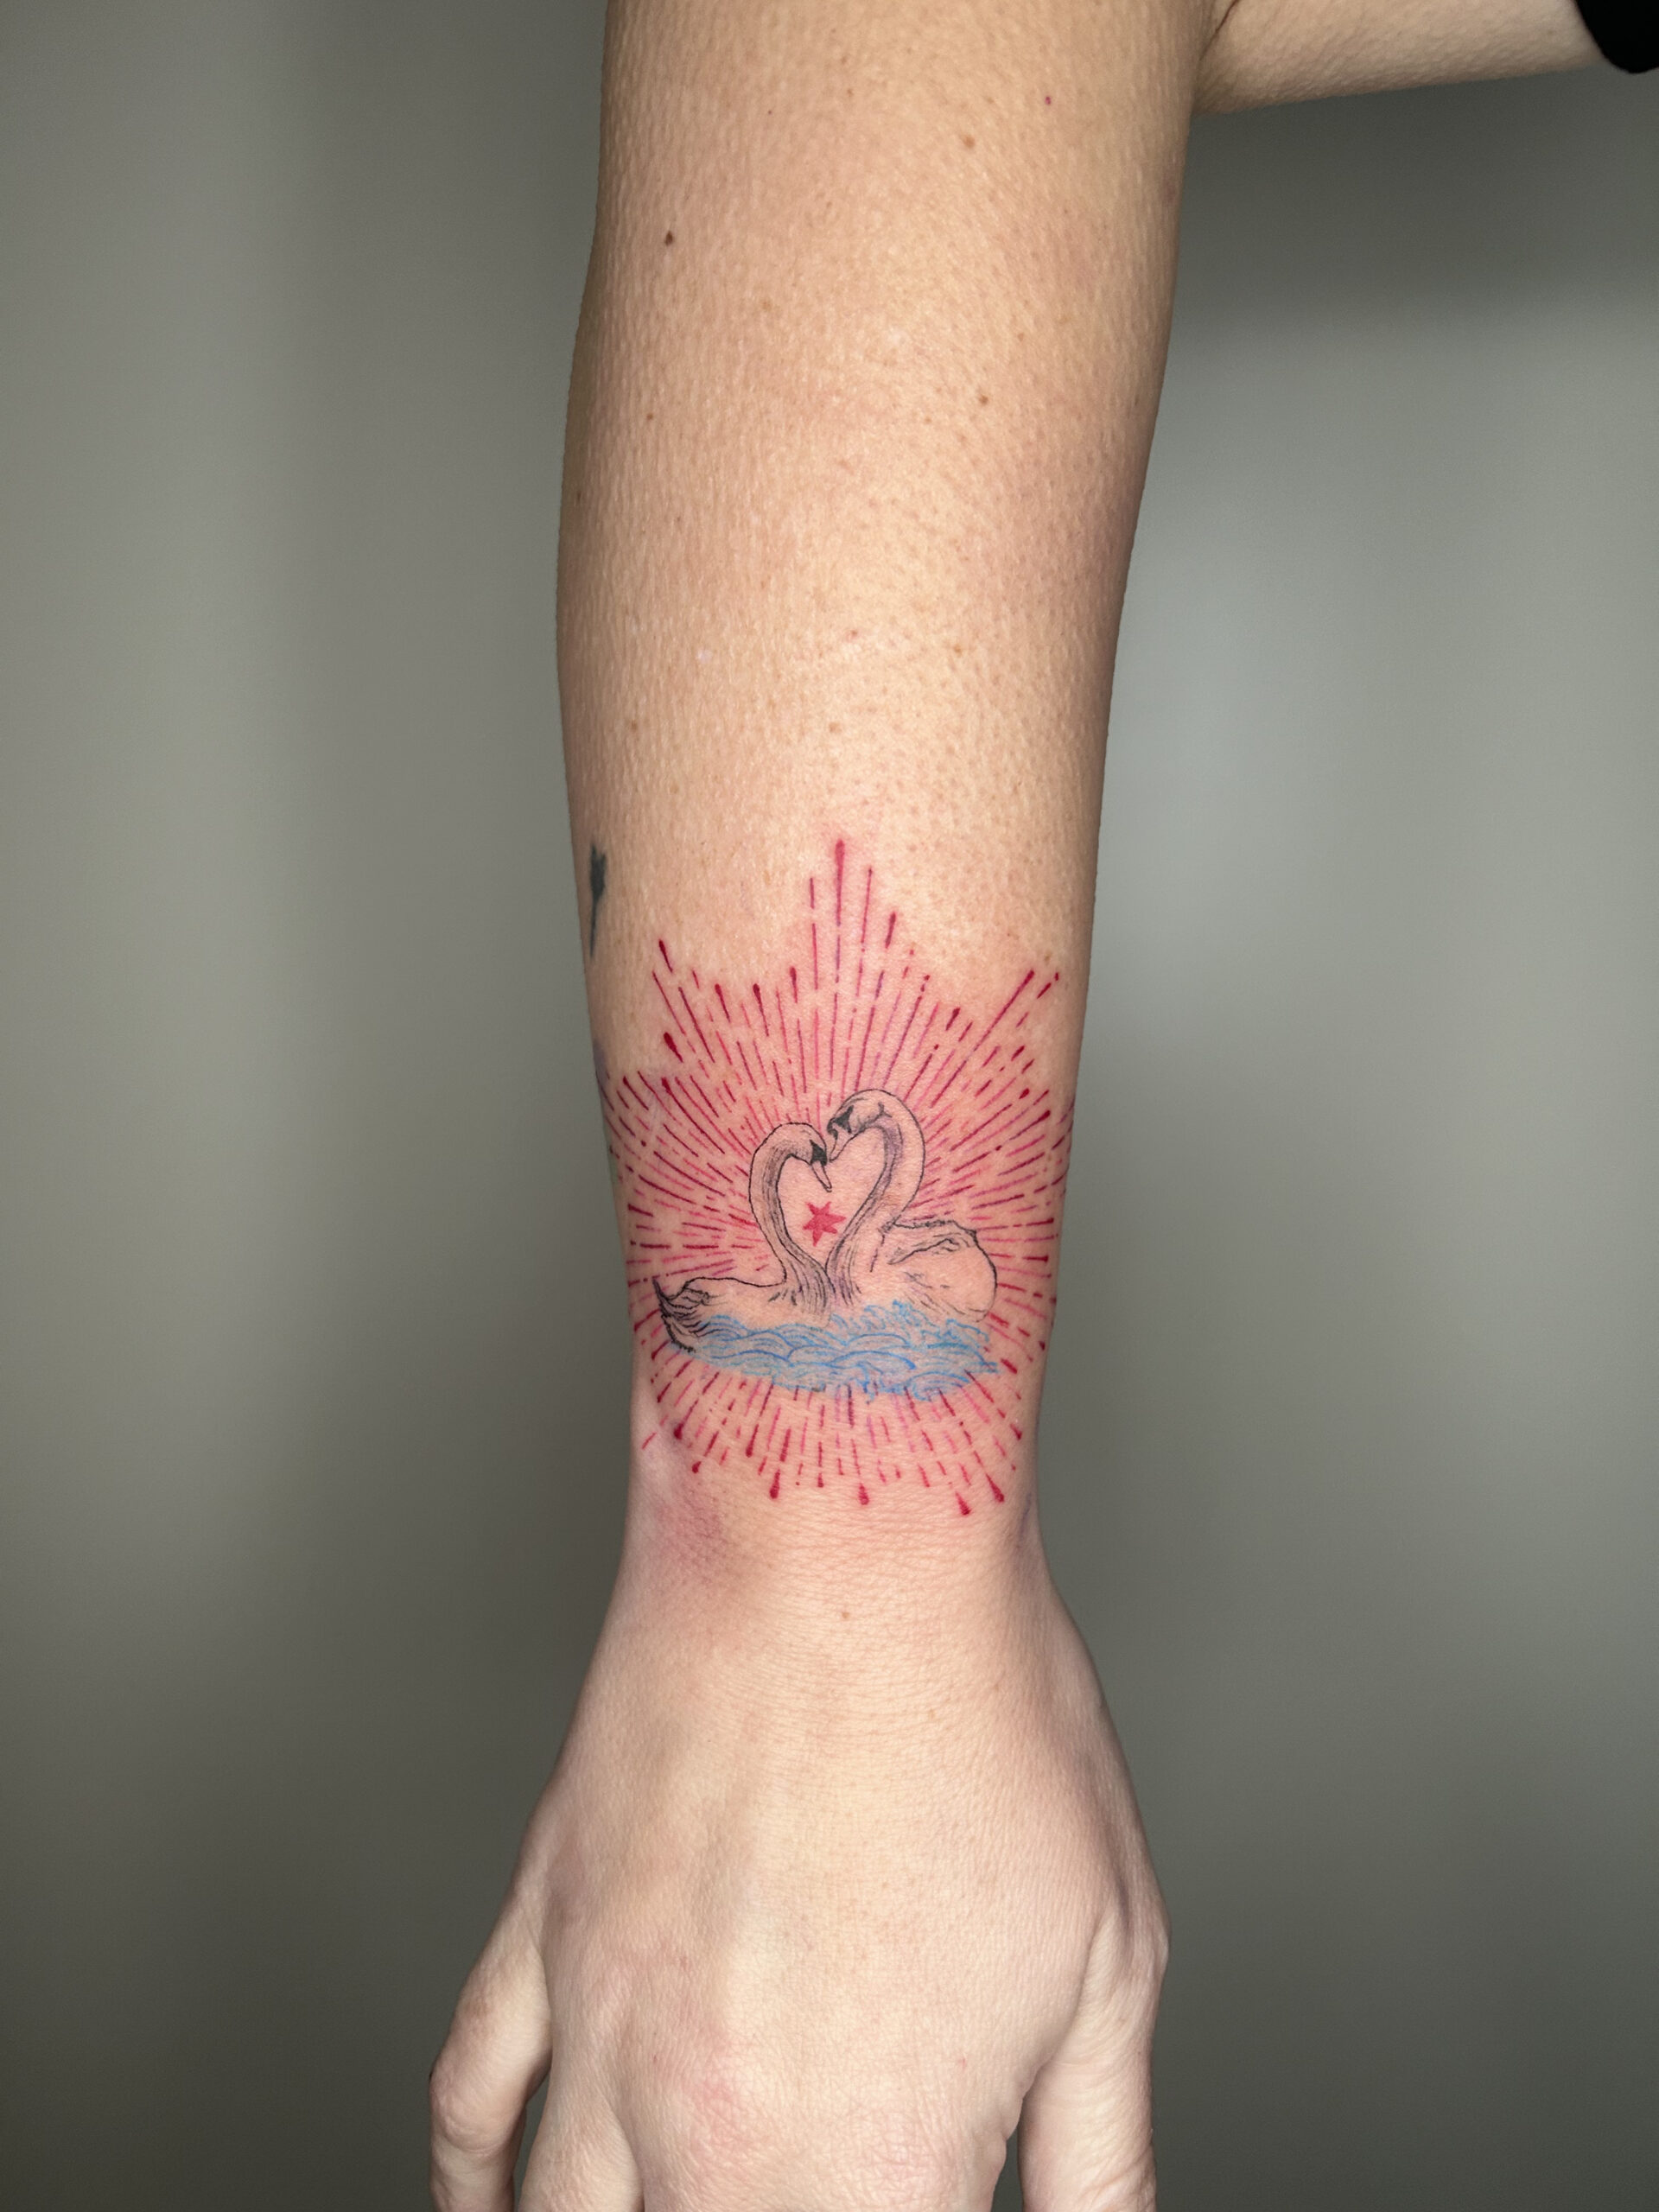
Most Popular Tattoo Locations:
- Upper arms: 41.5%
- Upper back/shoulder: 35.4%
- Lower arms: 34.5%
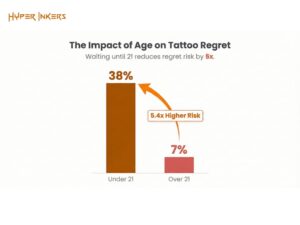
Age at First Tattoo:
- 40% got their first tattoo at age 18 or younger.
- 39% got their first between ages 19-29.
- The average age for a first tattoo is 22.6 years.
- Women are slightly more likely to initiate the process later, with 44% getting their first tattoo in the 19-29 age range.
6. Social and Workplace Acceptance
Public attitudes toward tattoos have transformed dramatically over the past two decades, moving from stigma to acceptance.
- Public Sentiment: 80% of Americans say society has become more accepting of tattoos.
- Reduced Stigma: Only 29% of non-tattooed adults report negative impressions of tattoos.
- Changing Perceptions: In 2008, 54% associated tattoos with rebelliousness; this percentage has dropped significantly in recent years.
Workplace Evolution
- Tattoo bans in professional settings have largely disappeared.
- Visible tattoos are now common across most industries.
- However, face and neck tattoos remain more controversial in strict corporate environments.
Cultural Milestones
To understand the speed of this adoption, consider the historical context:
- New York City actually banned tattooing from 1961 to 1997 due to hepatitis concerns.
- By 1996, tattooing ranked as the 6th fastest-growing retail venture.
- Peak growth coincided with the premiere of tattoo reality TV (Ink Master in 2012) and the rise of Instagram culture.
7. Conclusion and Future Outlook
The data clearly indicates that tattooing has evolved from a subcultural niche to a dominant form of American self-expression, with over one-third of the population participating. With Millennials and Gen Z leading the adoption, and women overtaking men, the industry is poised for continued diversification.
As the industry grows, so does the need for professional services—whether for creating new art or modifying old choices. If you are part of the growing demographic seeking high-quality body art services or solutions for tattoo regret, Hyper Inkers offers professional guidance to ensure your experience matches the highest industry standards.
8. Key Survey Methodology
Understanding the data sources is crucial for the accurate interpretation of these tattoo statistics.
Pew Research Center (2023) – Primary Source
- Sample size: 8,480 U.S. adults
- Survey date: July 2023
- Methodology: Nationally representative survey
- Key finding: 32% prevalence rate
Other Major Studies
- Harris Poll (2003-2015): Tracked the initial growth phase from 16% to 29%.
- Ipsos (2012, 2019): Confirmed the upward trend, recording 21% (2012) and 30% (2019).
- YouGov (2025): Found 24% (n=1,115) – As noted, methodological differences likely explain the variance.
- Utah BRFSS (2020-2021): Provided the largest sample (n=18,000+), specifically focused on health correlates.
Sources
- 32% of Americans have a tattoo, including 22% who have more than one – Pew Research Center
- More Americans Have Tattoos Today than Seven Years Ago – Ipsos
- Americans have become more favorable toward tattoos in the past decade – YouGov
- Tattoo Takeover: Three in Ten Americans Have Tattoos – Harris Poll/PR Newswire
- One in Five U.S. Adults Now Has a Tattoo – Harris Poll 2012
- Associations of demographic, health, and risk-taking behaviors with tattooing in ~18,000 US adults – PubMed Central
- Think Before You Ink: Perception, Prevalence, and Correlates of Tattooing and Tattoo Regret in US Adults – PubMed Central
- Trends in Tattoo-Related Google Search Data in the United States: Time-Series Analysis – PubMed Central
- United States – Age of Americans when they had their first tattoo 2019 – Statista
- Tattoo Statistics – How Many People Have Tattoos? – History of Tattoos
- Americans’ Tattoo Preferences and Regrets Data Study 2023 – Advanced Dermatology
- Tattoo Parlors & Tattoo Removal Is Now A Booming $4.5 Billion Industry – Market Research
- Tattoos in the Workplace Statistics – Stapaw
- White House ink: 58% of Americans OK with a president who has a visible tattoo – Washington Times